Homes got dearer faster than paycheques
You did everything right. You worked. You saved. You watched the listings and waited for the right year. And the finish line kept sliding down the road, like a bus you can see but never quite catch.
Here is the good news: it is not your imagination, and it is not your fault. Here is what the numbers say.
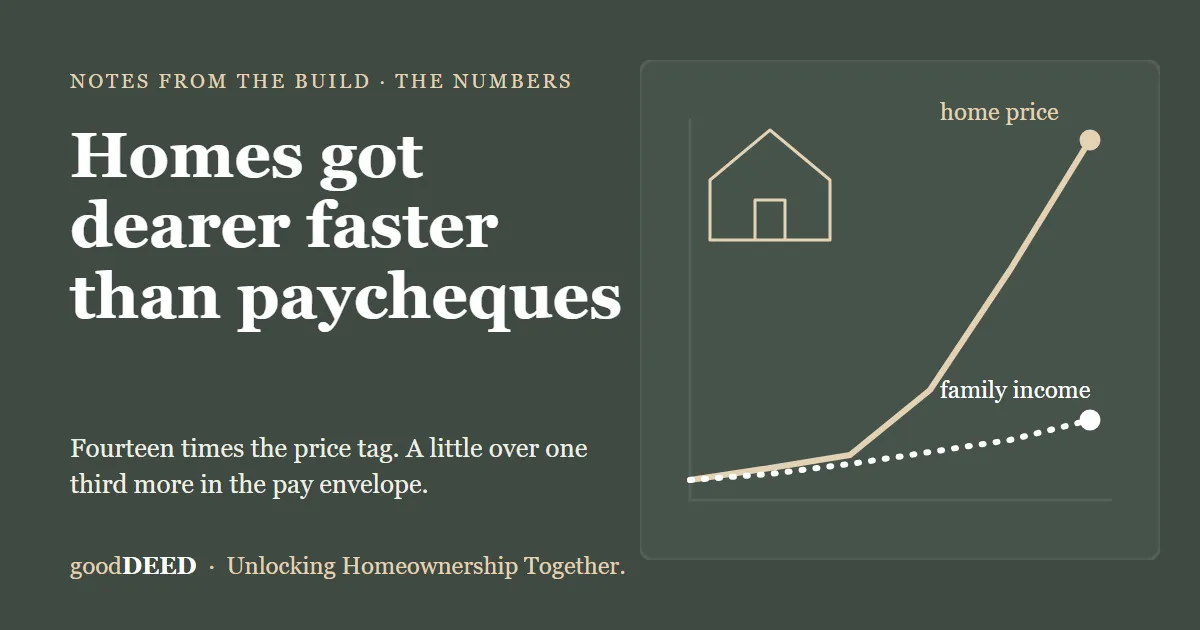
The price tag. In the Greater Toronto Area, the average home sold for $75,694 in 1980. In 2025 it sold for $1,067,707. That is about 14 times as much. Everyday prices rose about 3.7 times over the same years, so even after inflation, a GTA home costs nearly four times what it did.
The paycheque. Statistics Canada tracks what a typical Canadian family takes home after tax, in today's dollars. In 1980 it was $80,000. In 2024 it was $108,900. That is 36% more in 44 years, about 0.7% a year. In the year 2000 it was still lower than in 1980. Slow and steady, as it turns out, does not always win this race.
The scoreboard. Put the two side by side. The home grew almost four times in real terms. The family that has to live in it grew a little over one third. Not exactly a fair match.
One decade, close up. From 2007 to 2017, Statistics Canada found house prices rose about 69% while median incomes rose about 28%. No saving plan keeps up with that on willpower alone.
How it feels. In 2024, 23.2% of Canadian households spent 30% or more of their income on shelter. Among renters it was 33.7%. Just over one in four households (27.9%) said higher rent or mortgage payments had caused them financial difficulty. And 23.3% were unhappy with how affordable housing is, more than double the 11.1% in 2018. If you have been feeling it, you are in very large company.
The deposit. Among renters aged 25 to 39 who save in a registered account, a couple has a median of $20,250 put away. A 20% down payment on the 2025 GTA average price is $213,541, about ten times that. That is our arithmetic, for illustration. Programs such as the First Home Savings Account help, and each has its own limits. A mortgage professional can tell you what applies to you.
In fairness. Prices also fall. The GTA average dropped 28% between 1989 and 1996, and the benchmark price is down 28% from its February 2022 peak. A market that doubles and then gives back a decade of gains is a rollercoaster, not a plan. And one more honest note: these are Toronto-area prices set against Canada-wide incomes, so your city will differ.
Where goodDEED comes in. We do not promise prices will rise or fall. Nobody can, and anyone who says otherwise is selling something. We work on one thing: helping people who cannot buy alone find the right people to buy with, and agree how it will work before anything is signed. A home is where you live. We would like more people to be able to carry one.
Want to help shape it? Take our short questionnaire at gooddeed.ca/questionnaire, or see how Divide my Deed works at gooddeed.ca/divide-my-deed.
Sources: TRREB Historic Statistics (GTA average prices); Statistics Canada consumer price index, table 18-10-0005-01; Statistics Canada table 11-10-0190-01 (family income, 2024 dollars); Statistics Canada, Housing Statistics in Canada (2019); Statistics Canada, The Daily, 21 September 2026 (Canadian Housing Survey); TRREB MLS Home Price Index. This is general information, not legal, tax, mortgage or financial advice. Licensed professionals give the advice.
